Seeing More with Less:
Human-Like Representations in Vision Models
Andrey Gizdov1,2 Shimon Ullman1,3 Daniel Harari1,3
CVPR 2025 • Spotlight
Paper (PDF)
Video Presentation
Code (coming soon)
Andrey Gizdov1,2 Shimon Ullman1,3 Daniel Harari1,3
![]() Foveated sampling boosts accuracy of leading LMMs (BLIP-2, LLaVA, ViLT, MDETR, InstructBLIP) by up to 2.7 % under identical pixel budgets.
Foveated sampling boosts accuracy of leading LMMs (BLIP-2, LLaVA, ViLT, MDETR, InstructBLIP) by up to 2.7 % under identical pixel budgets.
![]() Only 3 % pixels → 80 % performance. Scaling curves reveal strong diminishing returns of resolution.
Only 3 % pixels → 80 % performance. Scaling curves reveal strong diminishing returns of resolution.
![]() Variable sampling induces human-like global self-attention & resolution-selective neurons in CNNs and transformers.
Variable sampling induces human-like global self-attention & resolution-selective neurons in CNNs and transformers.
![]() Enables vision on 5–10 × lower bandwidth for UAVs, IoT cameras & wearables while retaining 80–95 % accuracy.
Enables vision on 5–10 × lower bandwidth for UAVs, IoT cameras & wearables while retaining 80–95 % accuracy.
The human eye keeps only a thumb-nail-sized region in razor-sharp focus while resolution falls towards the periphery.
This mechanism is known as foveation and is a clever way to reduce the amount of visual information our brain needs to process while still capturing fine details + a wide field-of-view.
Modern vision–language models, however, treat every pixel equally, incurring extra compute and memory for information that often matters less.
We explore a simple thought experiment: keep the total pixel count unchanged, but concentrate pixels around a chosen fixation point
and reduce them in the periphery, mirroring the retina’s layout.
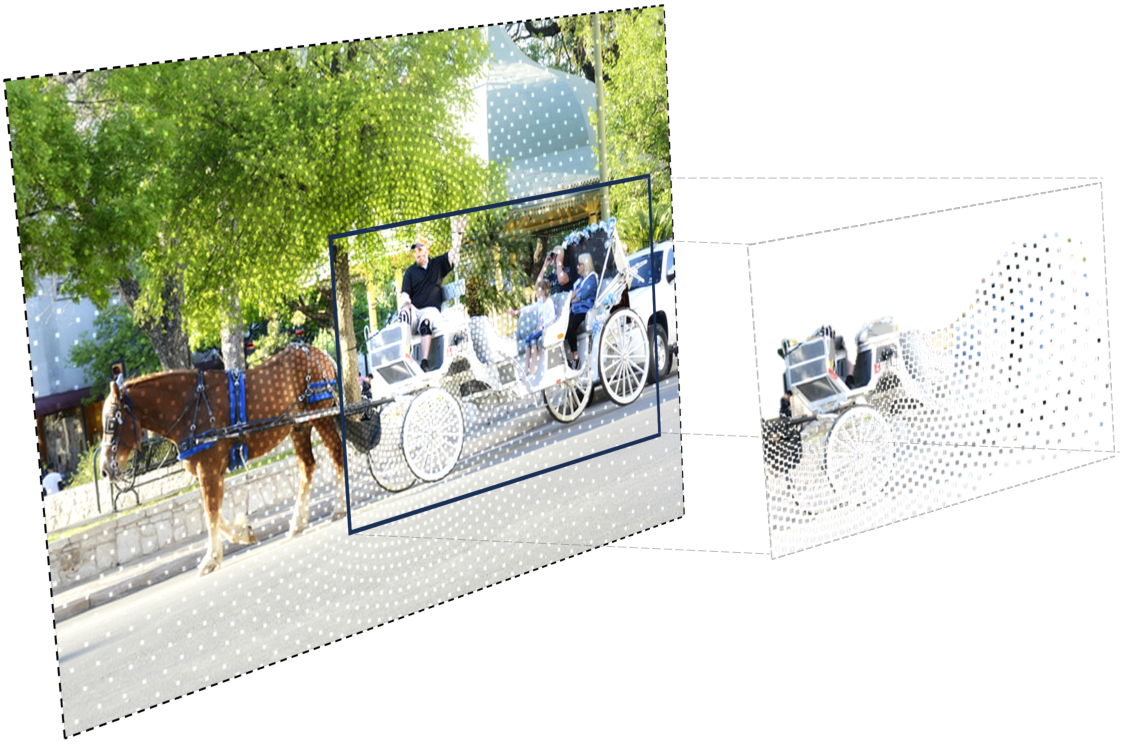
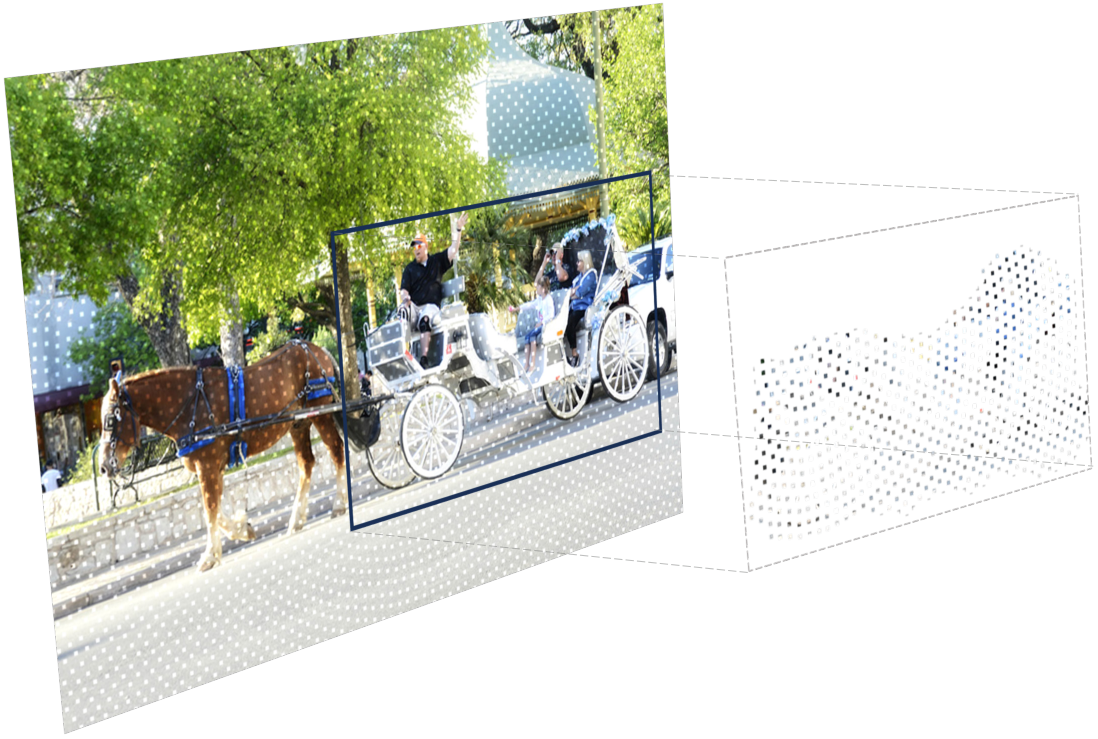
Given that the two (motorbike) representations above both comprise the same number of pixels, just distributed differently, we simply ask which visual representation is better for vision models. The result is measurable and task-agnostic: with the same 3 % pixel budget VLMs gain +2.7 % accuracy on visual question answering and +2.2 % on object detection. In short, variable sampling delivers consistent gains even without re-training models.
The image bellow is too large to (1) be transmitted over most network channels in real time; (2) too large to store in memory; (3) too large to process via VLMs.
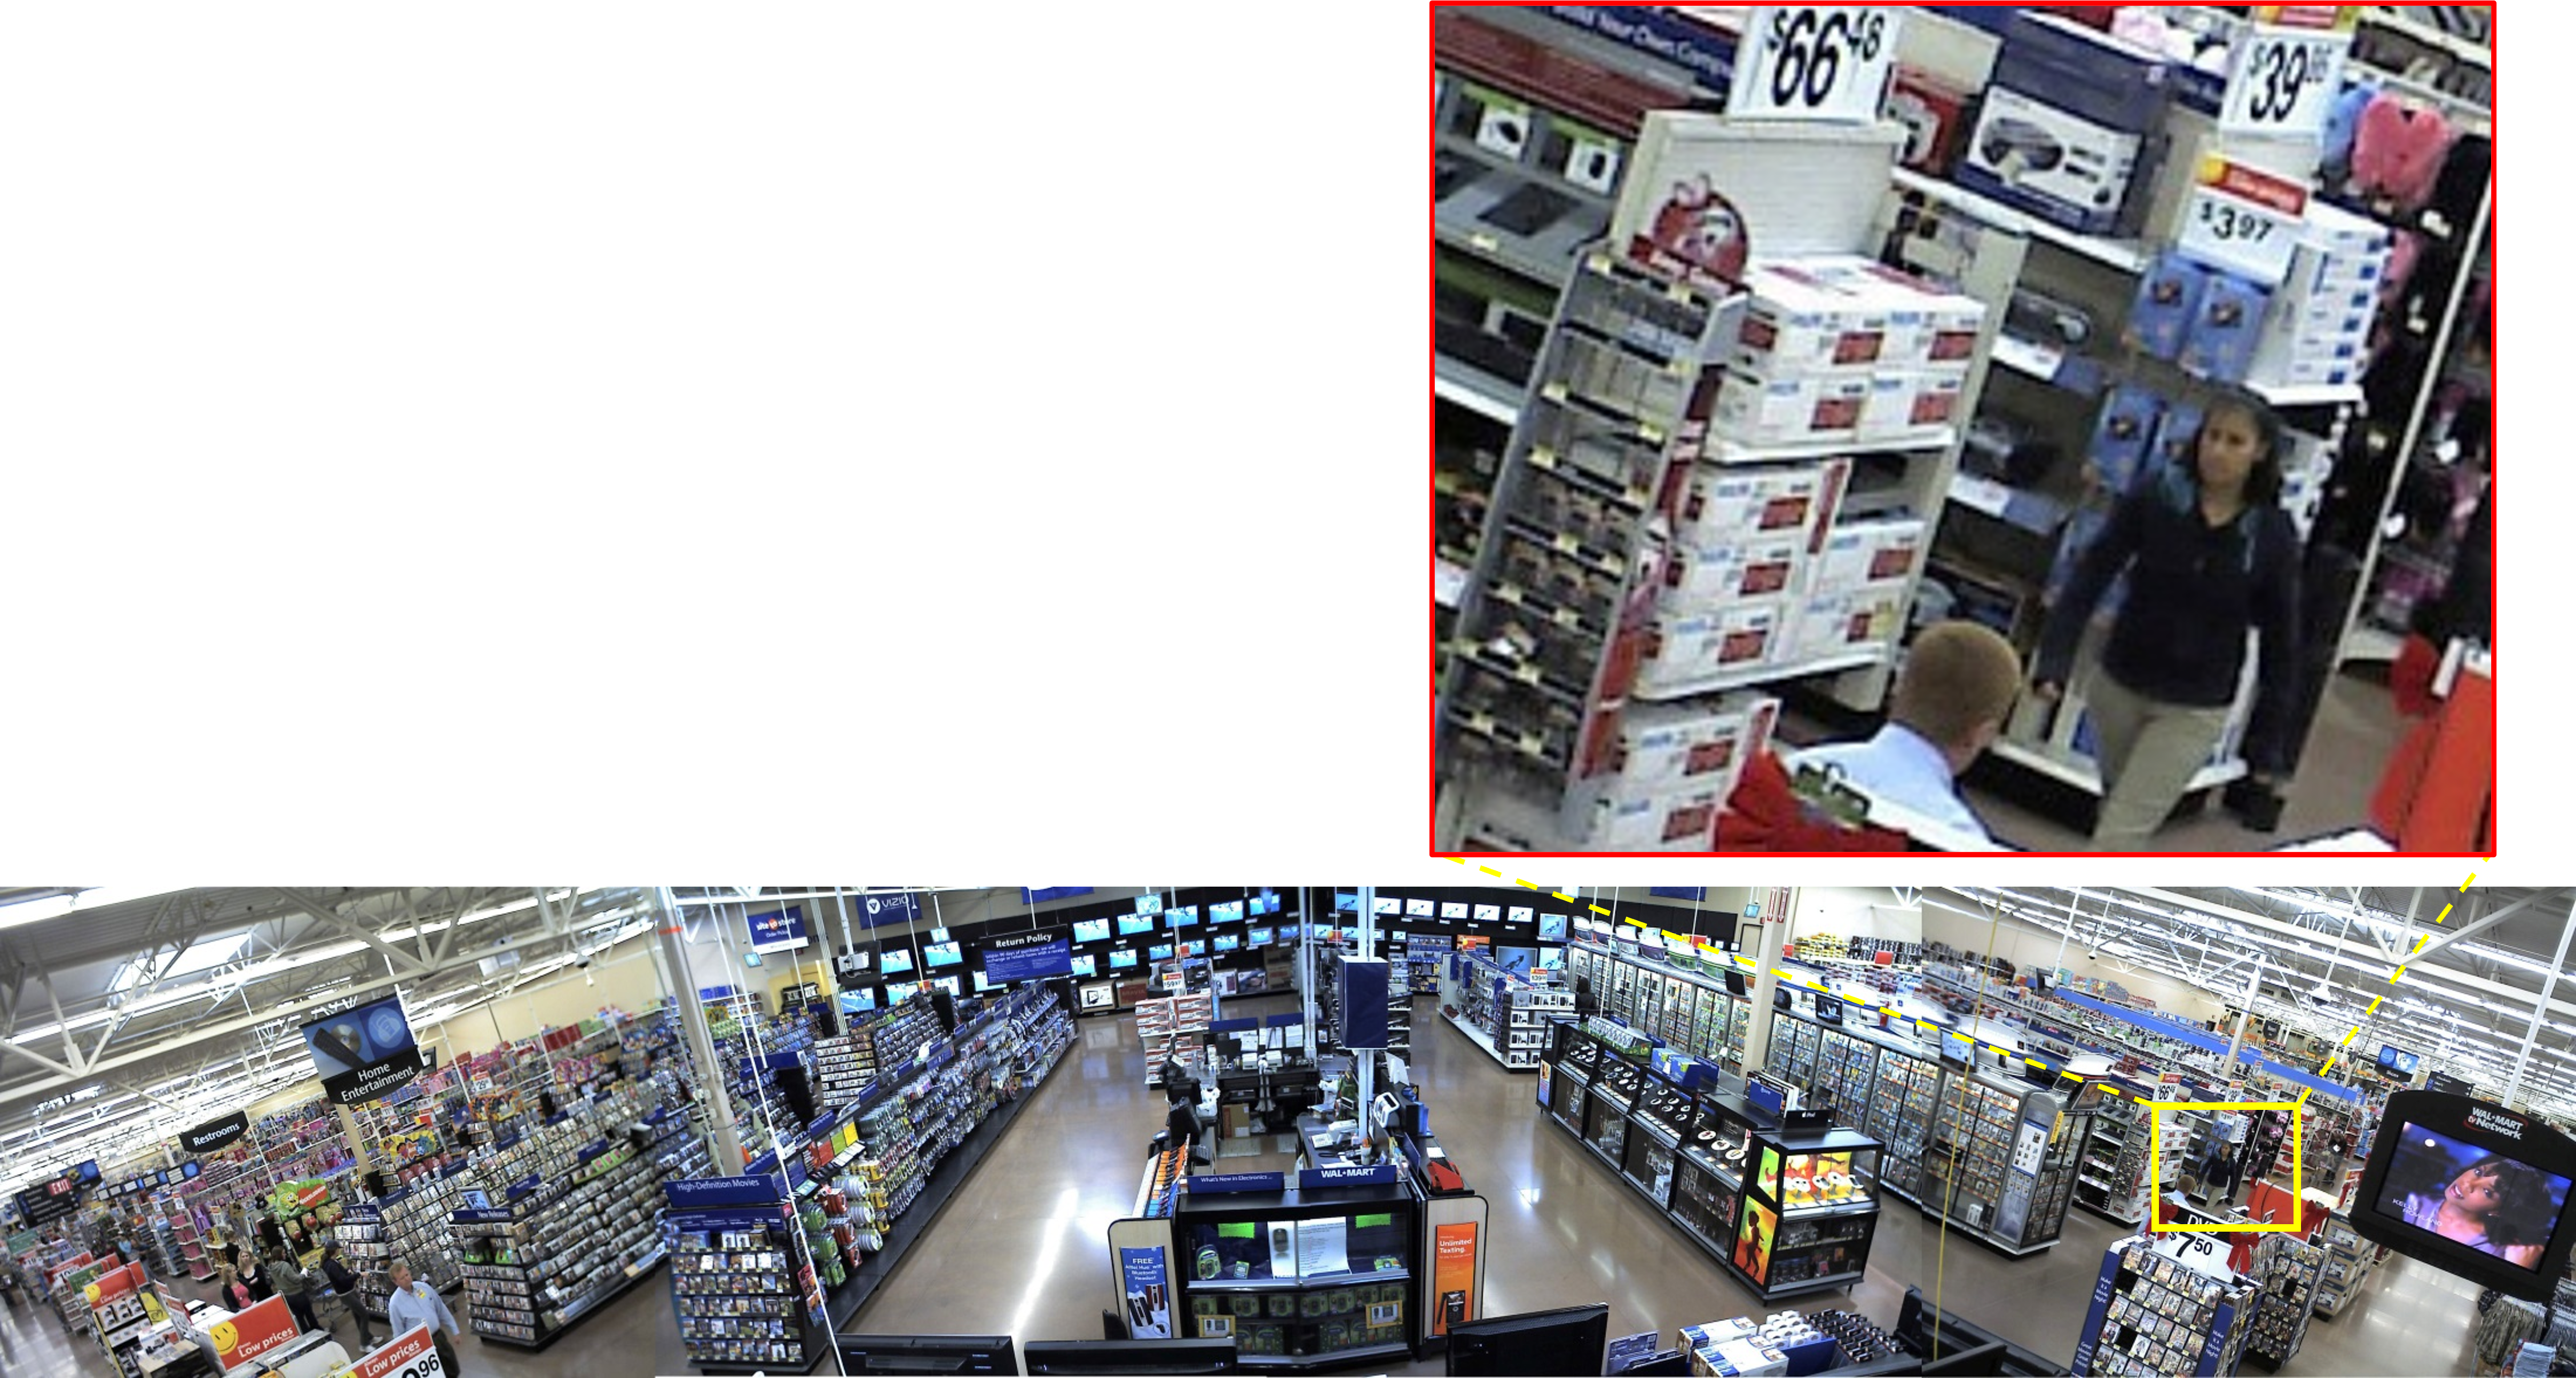

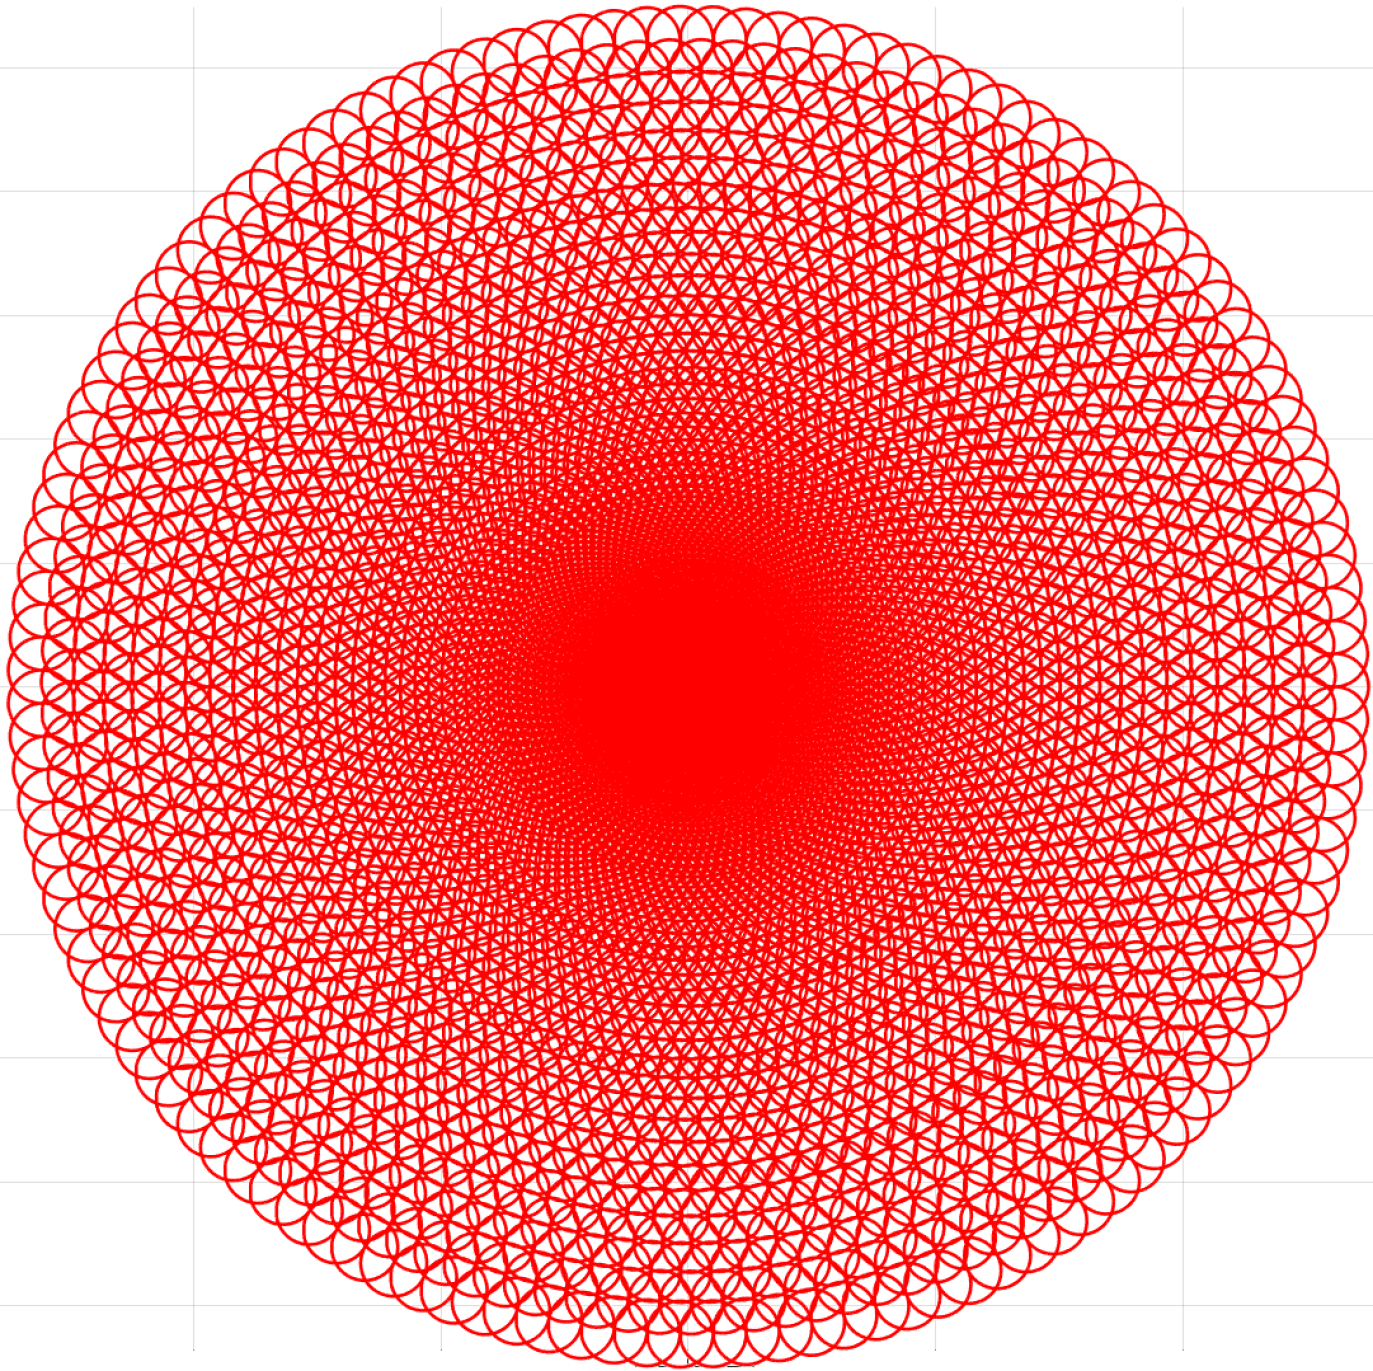
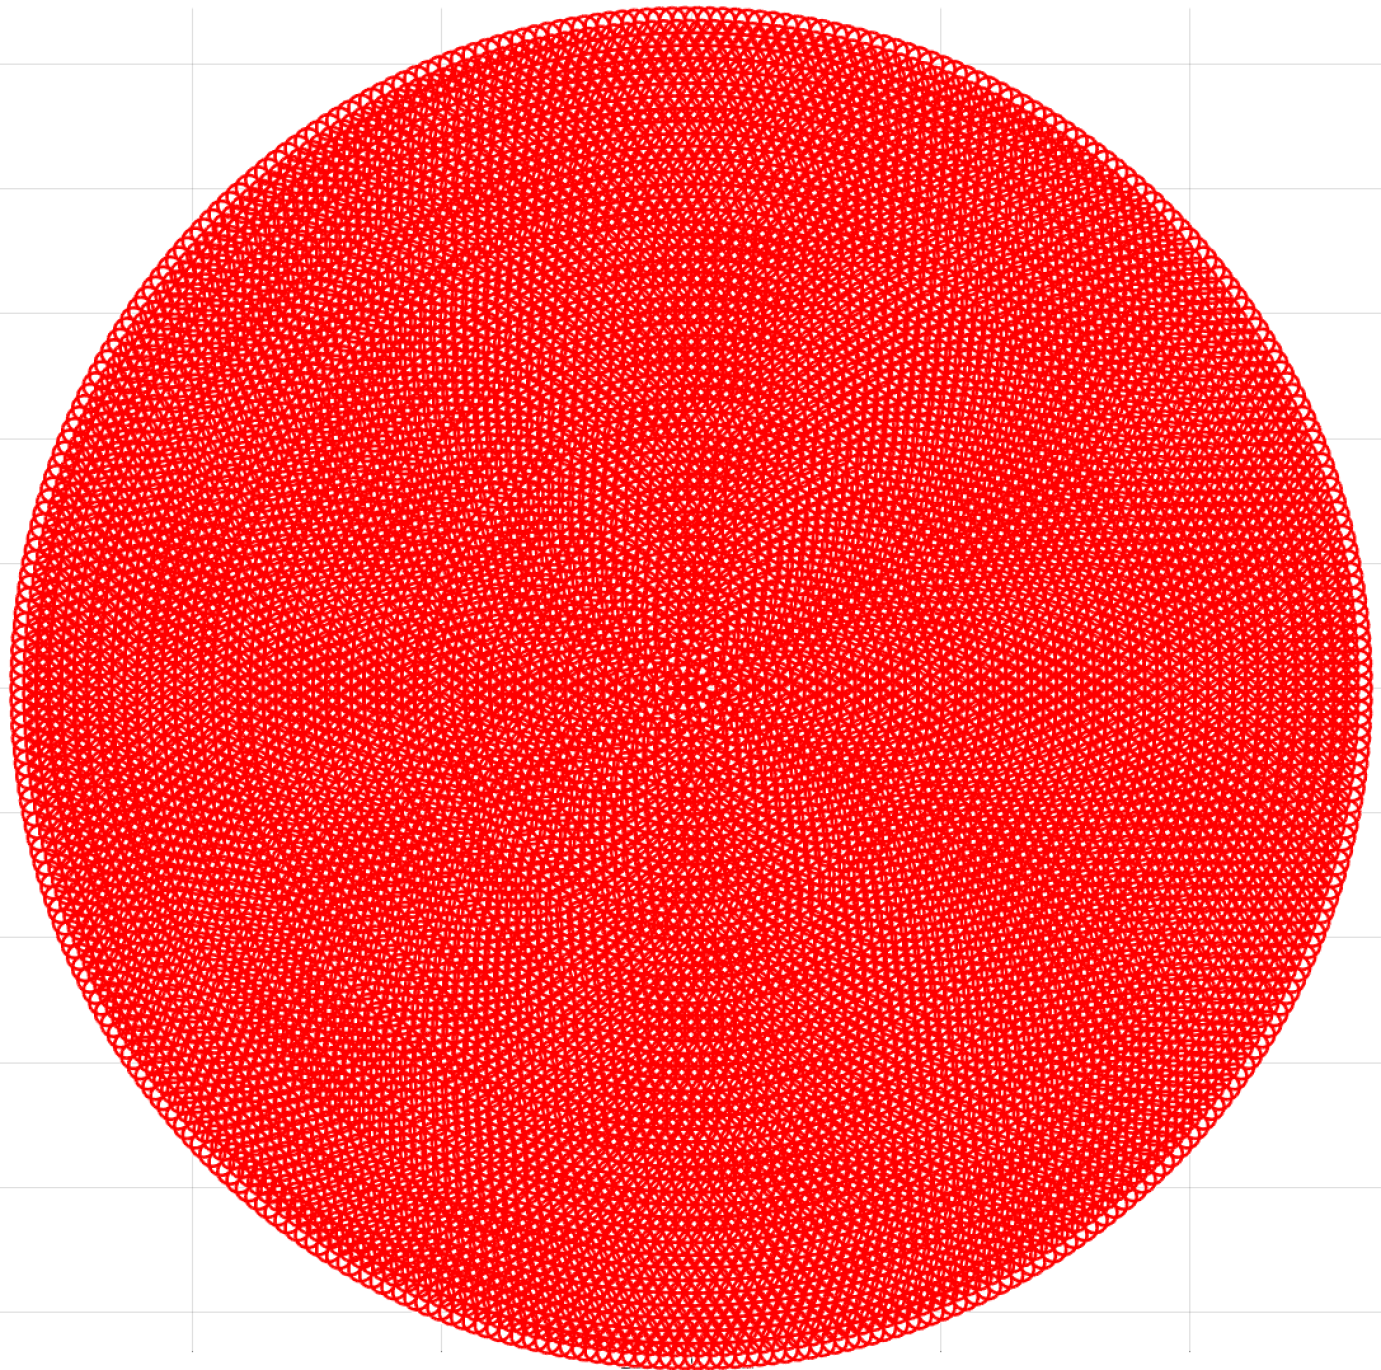
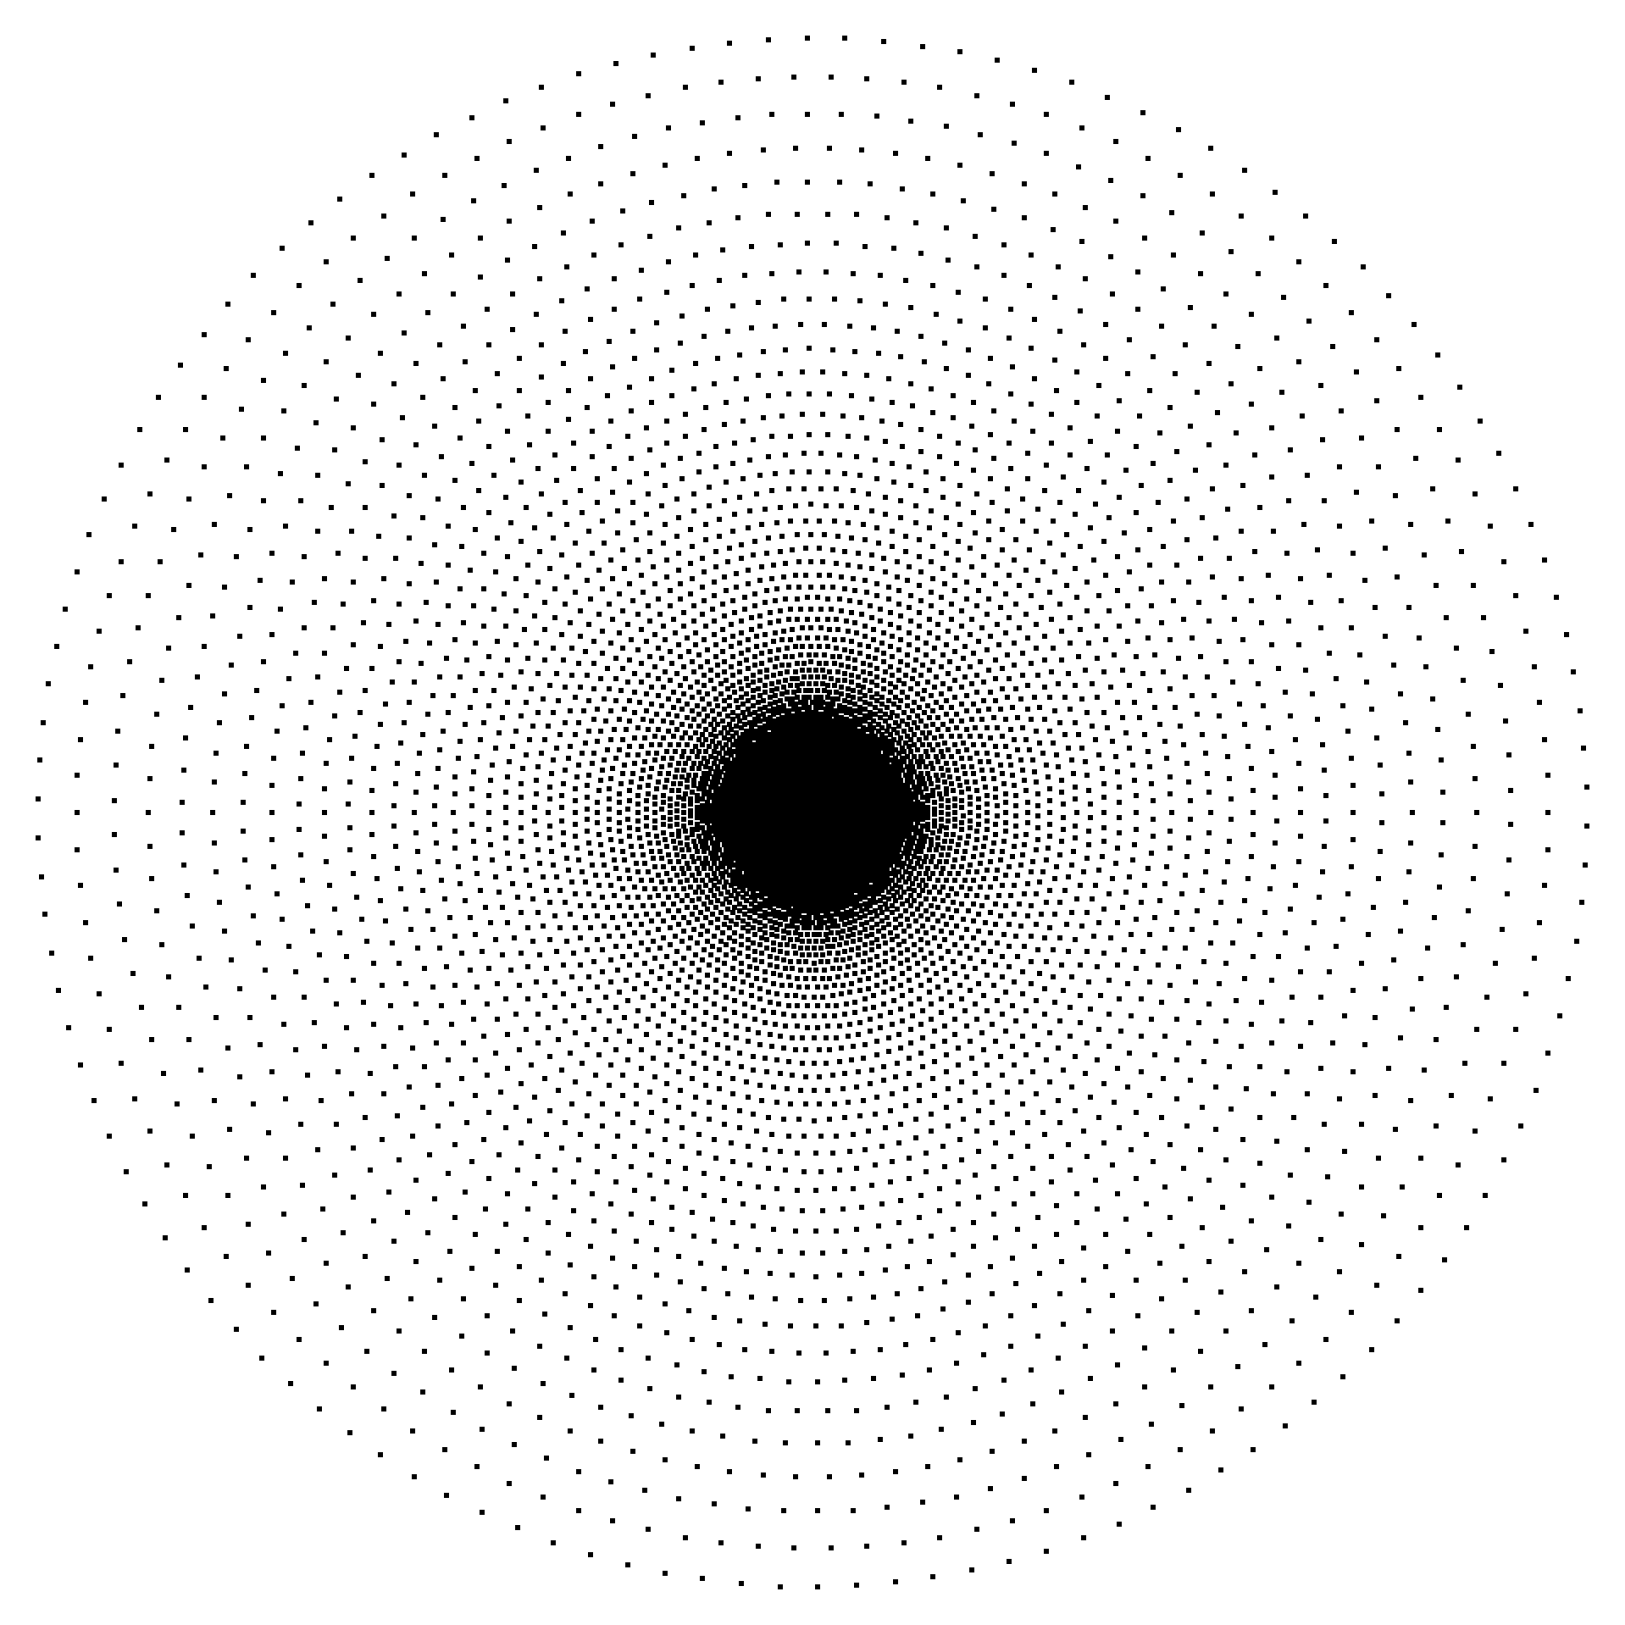
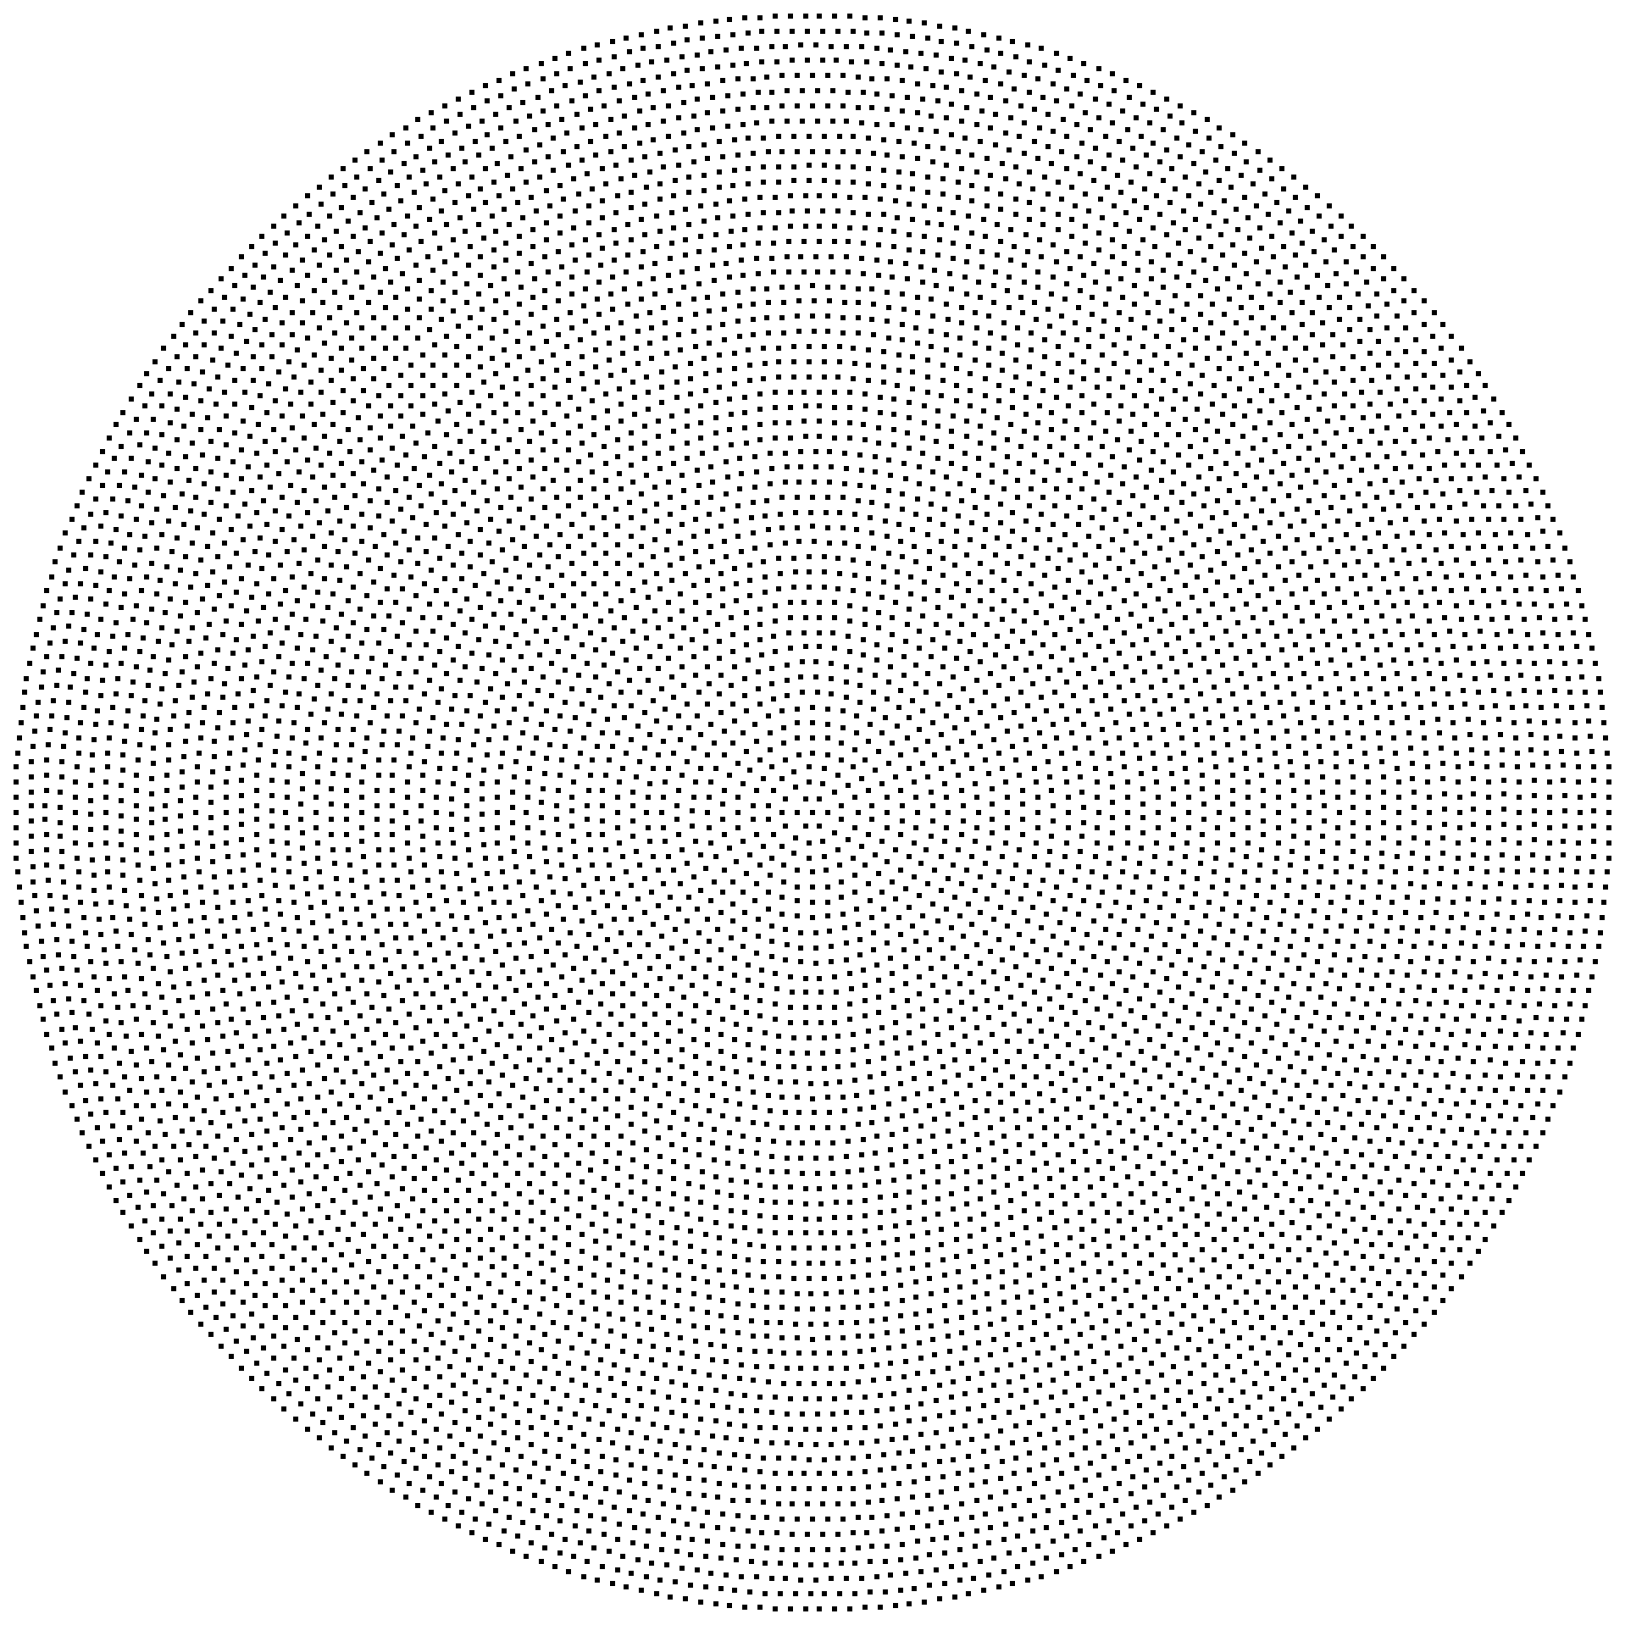
All three schemes live on the same log-polar coordinate transform \[ (r,\theta)=\Bigl(\log\!\bigl(\sqrt{(x-x_f)^2+(y-y_f)^2}\bigr),\; \arctan\!\frac{y-y_f}{x-x_f}\Bigr), \] where \((x_f,y_f)\) is the fixation point. For Svar we allocate a fixed quota of samples to concentric annuli whose area decreases linearly with radius—mimicking the widening receptive fields of retinal ganglion cells. For Suni each annulus contains the same number of samples, yielding an even pixel density.
We mask the original image with the sampling maps, \(I(x,y)\), and then reconstruct a full-resolution frame with bilinear interpolation. \[ \hat I = \mathcal I\bigl(I(x,y)\cdot S(x,y)\bigr), \] ensuring that model architectures remain unchanged. At 3 % density a 720 p frame shrinks from 1.3 MB to ~45 kB on the wire.
We evaluate three vision tasks across seven representative models:
Foveated inputs outperform uniform down-scaling across all benchmarks. STable 2–6 (supplementary) give full breakdowns by question category; a snapshot for ViLT and BLIP-2 on VQAv2 is shown below.
We shift the fovea 100 px toward each corner. Accuracy varies by < 0.5 % (STable 1). Conclusion: performance stems from variable density—not from a lucky fixation bias.
| Model | #Total Params | Dataset | Variable | Variable Std. | Uniform |
|---|---|---|---|---|---|
| MDETR-ResNet101-RoBERTa | 169M | GQA | 46.79% | ±0.01% | 44.13% |
| BLIP-2-FlanT5XL | 3.4B | GQA | 42.27% | ±0.21% | 40.72% |
| BLIP-2-FlanT5XL | 3.4B | VQAv2 | 57.89% | ±0.46% | 56.19% |
| InstructBLIP-FlanT5XL | 4B | VQAv2 | 66.37% | ±0.56% | 66.48% |
| ViLT-B/32 | 87.4M | VQAv2 | 64.90% | ±0.82% | 63.01% |
| LLaVa-v1.5 | 13B | VQAv2 | 65.91% | ±0.75% | 65.14% |
On GQA we observe a consistent +2 – 3 pp gain in mAP50:95. To isolate resolution effects we also evaluate only those objects whose masks cover an equal number of samples in both schemes (sample-equalised COCO subset). The table below shows that variable sampling still edges out uniform, especially for small objects.
| Model | Sampling | AR | ARS | ARM | ARL |
|---|---|---|---|---|---|
| DETR-R101 | Baseline | 54.8 | 15.3 | 51.9 | 72.0 |
| DETR-R101 | Uniform | 37.1 | 1.2 | 28.0 | 51.6 |
| DETR-R101 | Variable | 38.5 | 2.1 | 31.0 | 54.7 |
| Mask RCNN-R101 | Baseline | 52.5 | 25.6 | 49.7 | 64.2 |
| Mask RCNN-R101 | Uniform | 34.7 | 1.6 | 27.7 | 48.2 |
| Mask RCNN-R101 | Variable | 36.9 | 3.4 | 31.7 | 48.6 |
STable 7 (supplementary) provides additional detailed breakdowns by object size and category.
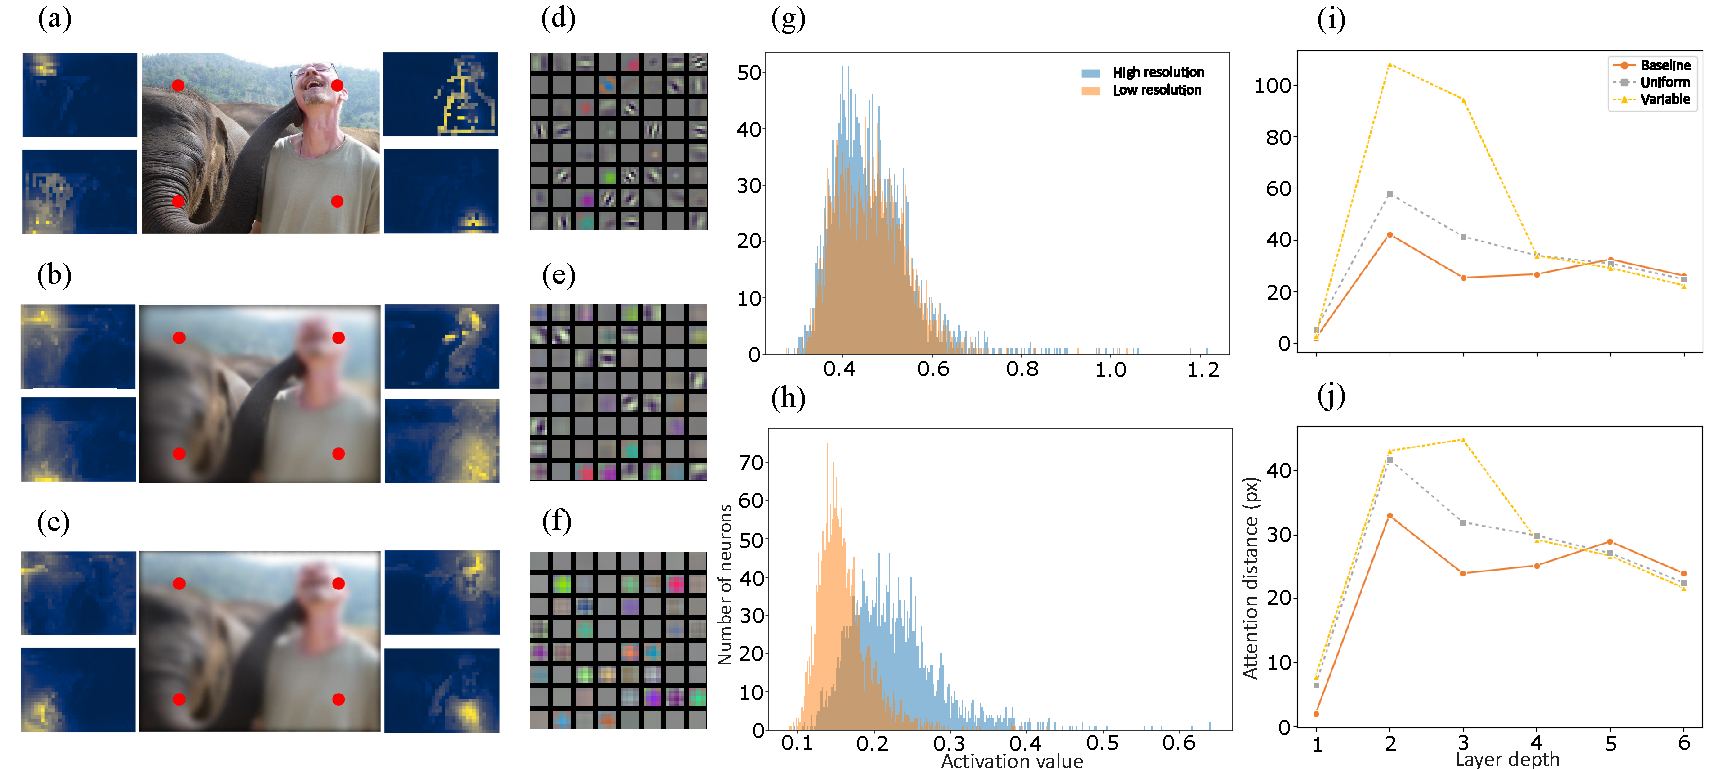
Transformers. Average attention-distance grows by 30 % in foveated inputs, paralleling the long-range lateral connections of V1. CNNs. A permutation test on 5 k tensors (see §5 in the supplement) rejects H0 (p < 10-3): neurons specialise for high- vs low-resolution inputs.
A LoRa-equipped drone is capped at ≈ 70 kbit s-1. Our 3 % pipeline streams a 720 p scene at ≈ 45 kbit s-1 while retaining ~80 % of full-resolution accuracy—enabling minimum bandwidth AI control.